What's a 30% Lead Lift Actually Worth? | The Unlock

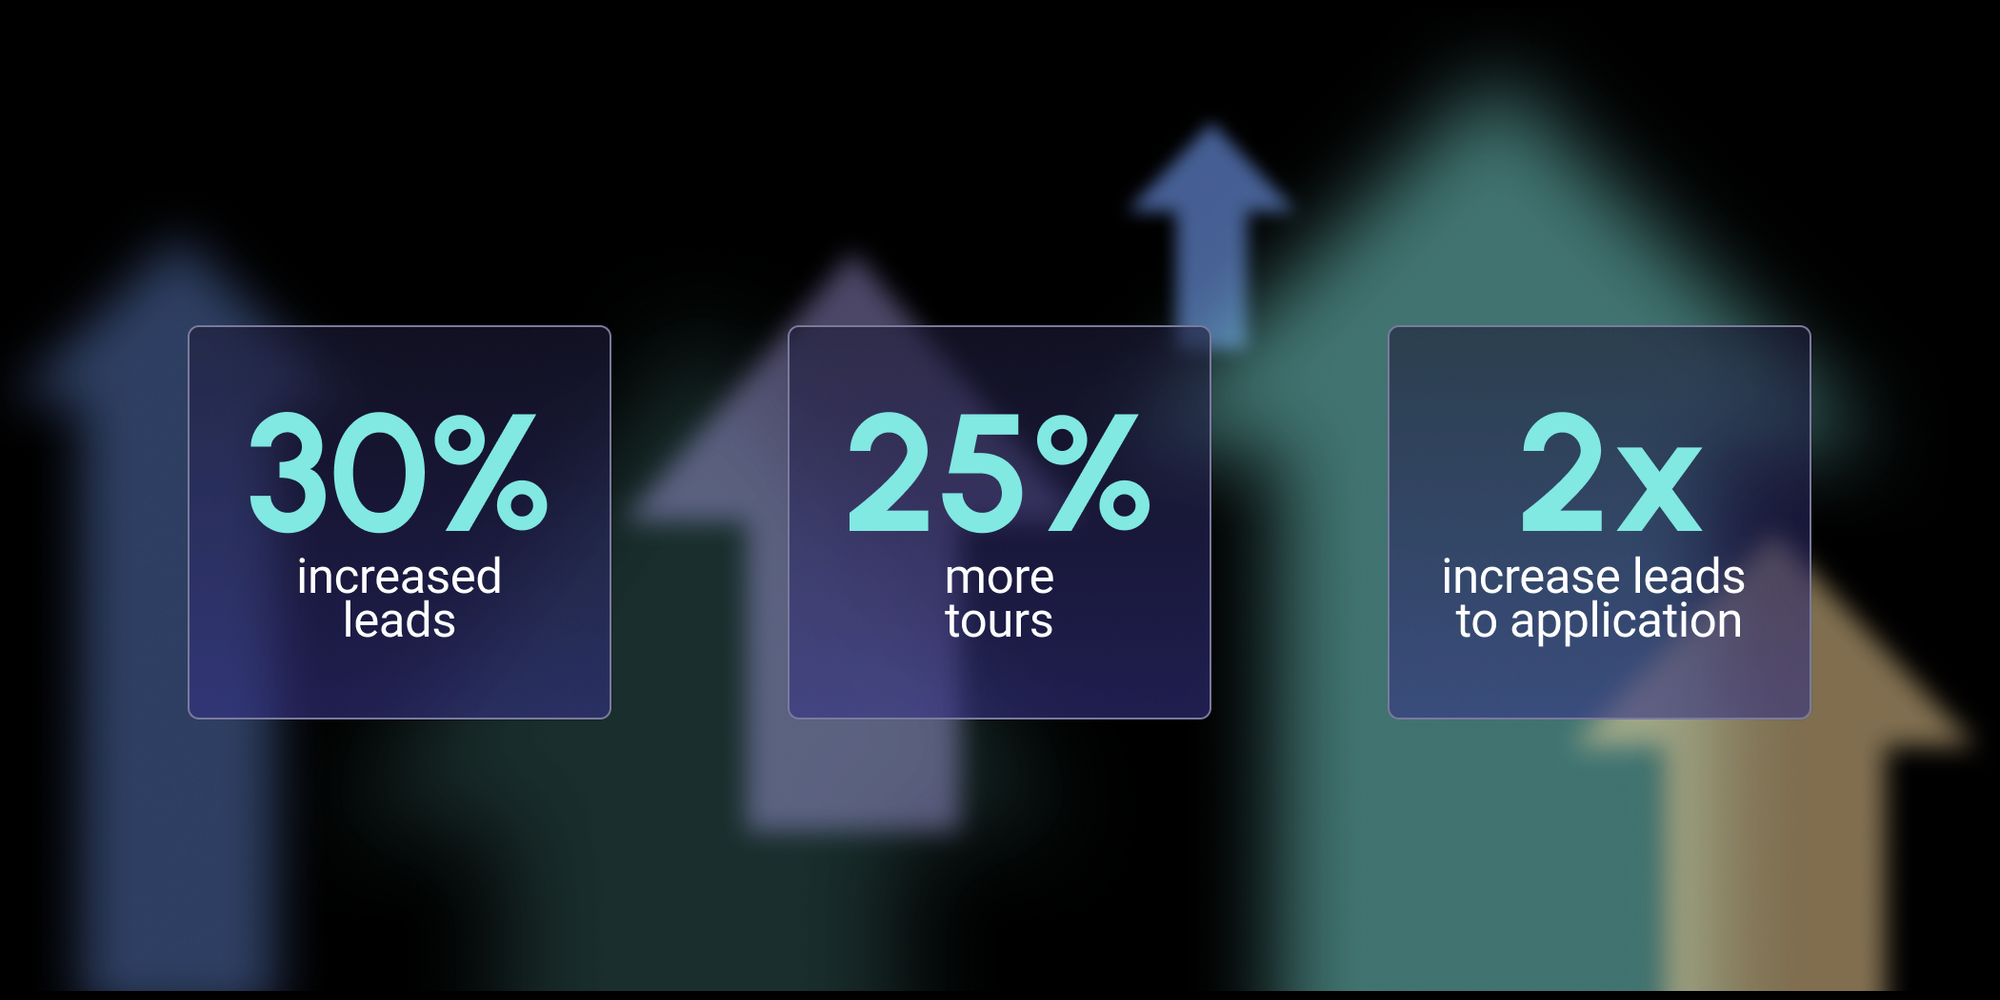
Increase leads by 30%. Book 25% more tours. Double your lead-to-application rate.
It’s multifamily budget season again, which means hard decisions about where the marketing and technology dollars go. Every vendor has their own case study. Their own claims… and then comes the question from asset management: what does this spend actually do to the bottom line?
It’s not controversial that a property budget needs some marketing and technology spend. But how much? What does the extra $10,000 a year actually achieve? How do you make the call between more ILS spend and the latest leasing technology?
It’s always been hard to tie funnel improvements to actual revenue. Occupancy is a complex equation: renewals, leads, approval rates, and a multitude of other factors.
So we built a tool to help you cut through the noise and spend an already tight budget better.
How did we build it?
We looked at 46 multifamily vendors and studies across seven solution types:
- AI leasing assistants and CRM
- Listing sites
- Advertising and agencies
- Reputation, reviews and resident satisfaction
- Self-guided tours
- 3D and virtual tours
- Screening, verification and deposit alternatives
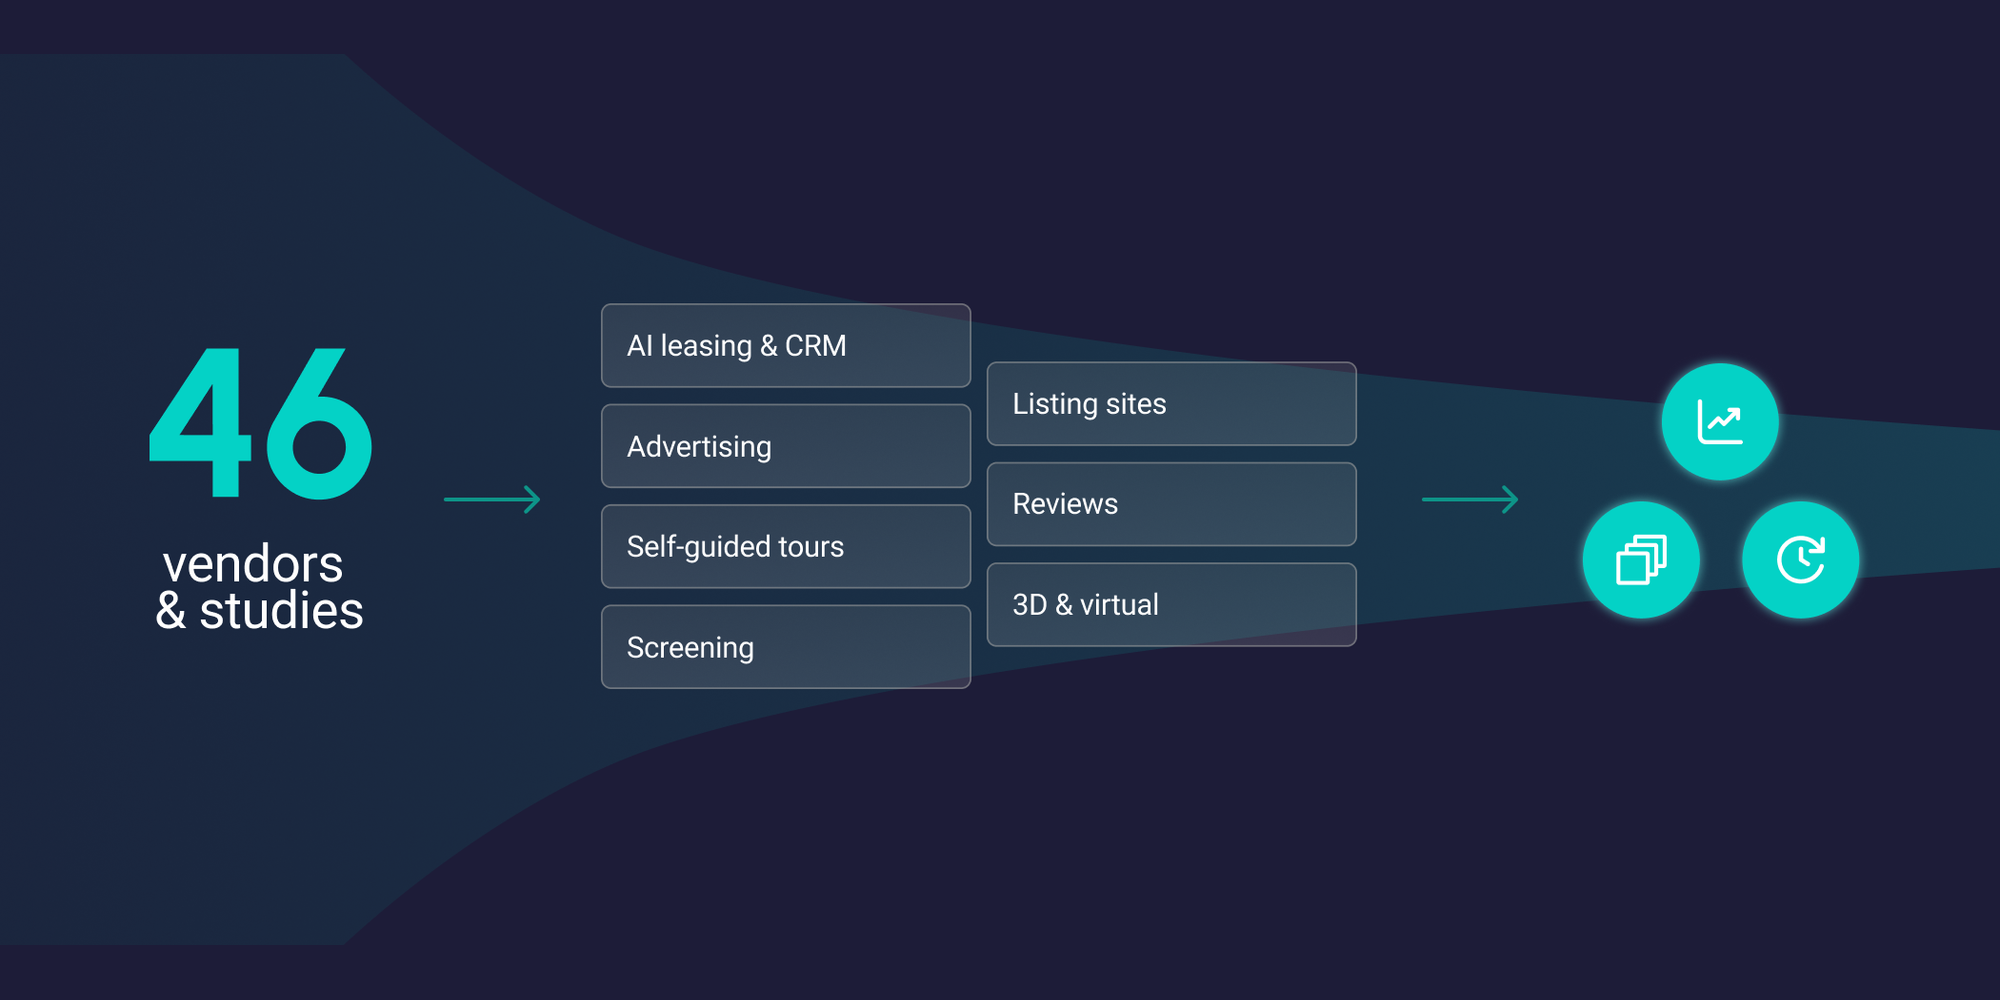
Then we took every publicly quoted figure and sorted it into the three levers that actually move vacancy: lead volume, time to conversion, and conversion rate.
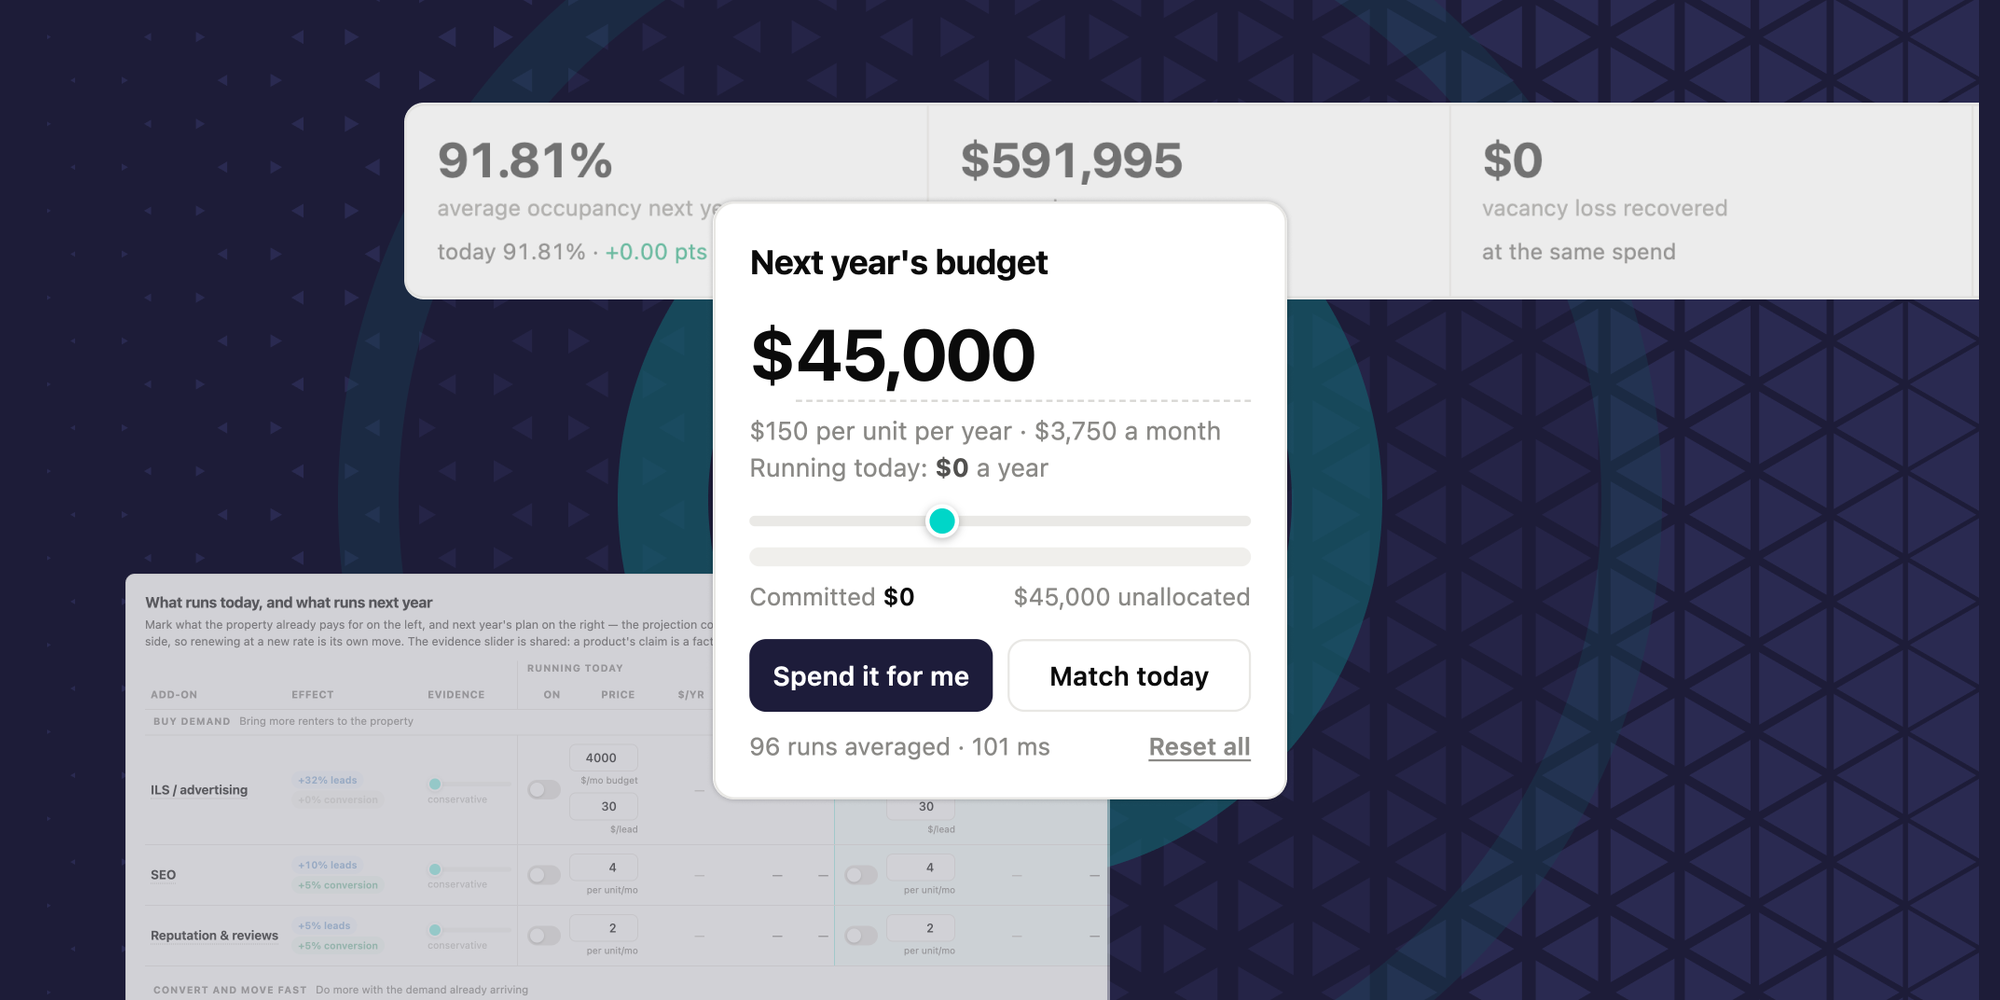
Enter your units, rents, renewal rate, and make-ready time. Mark what you pay for today against what you’re planning for next year. Then you can answer:
- What are my empty units actually costing me?
- Should I buy more leads or fix my speed to lease?
- Is the expensive version of a product worth the premium over the cheap one?
An example
Take a 300-unit property, 92% occupied, 45% annual turnover, rents from $1,500 to $2,700. Do nothing next year and vacancy costs you $591,995.
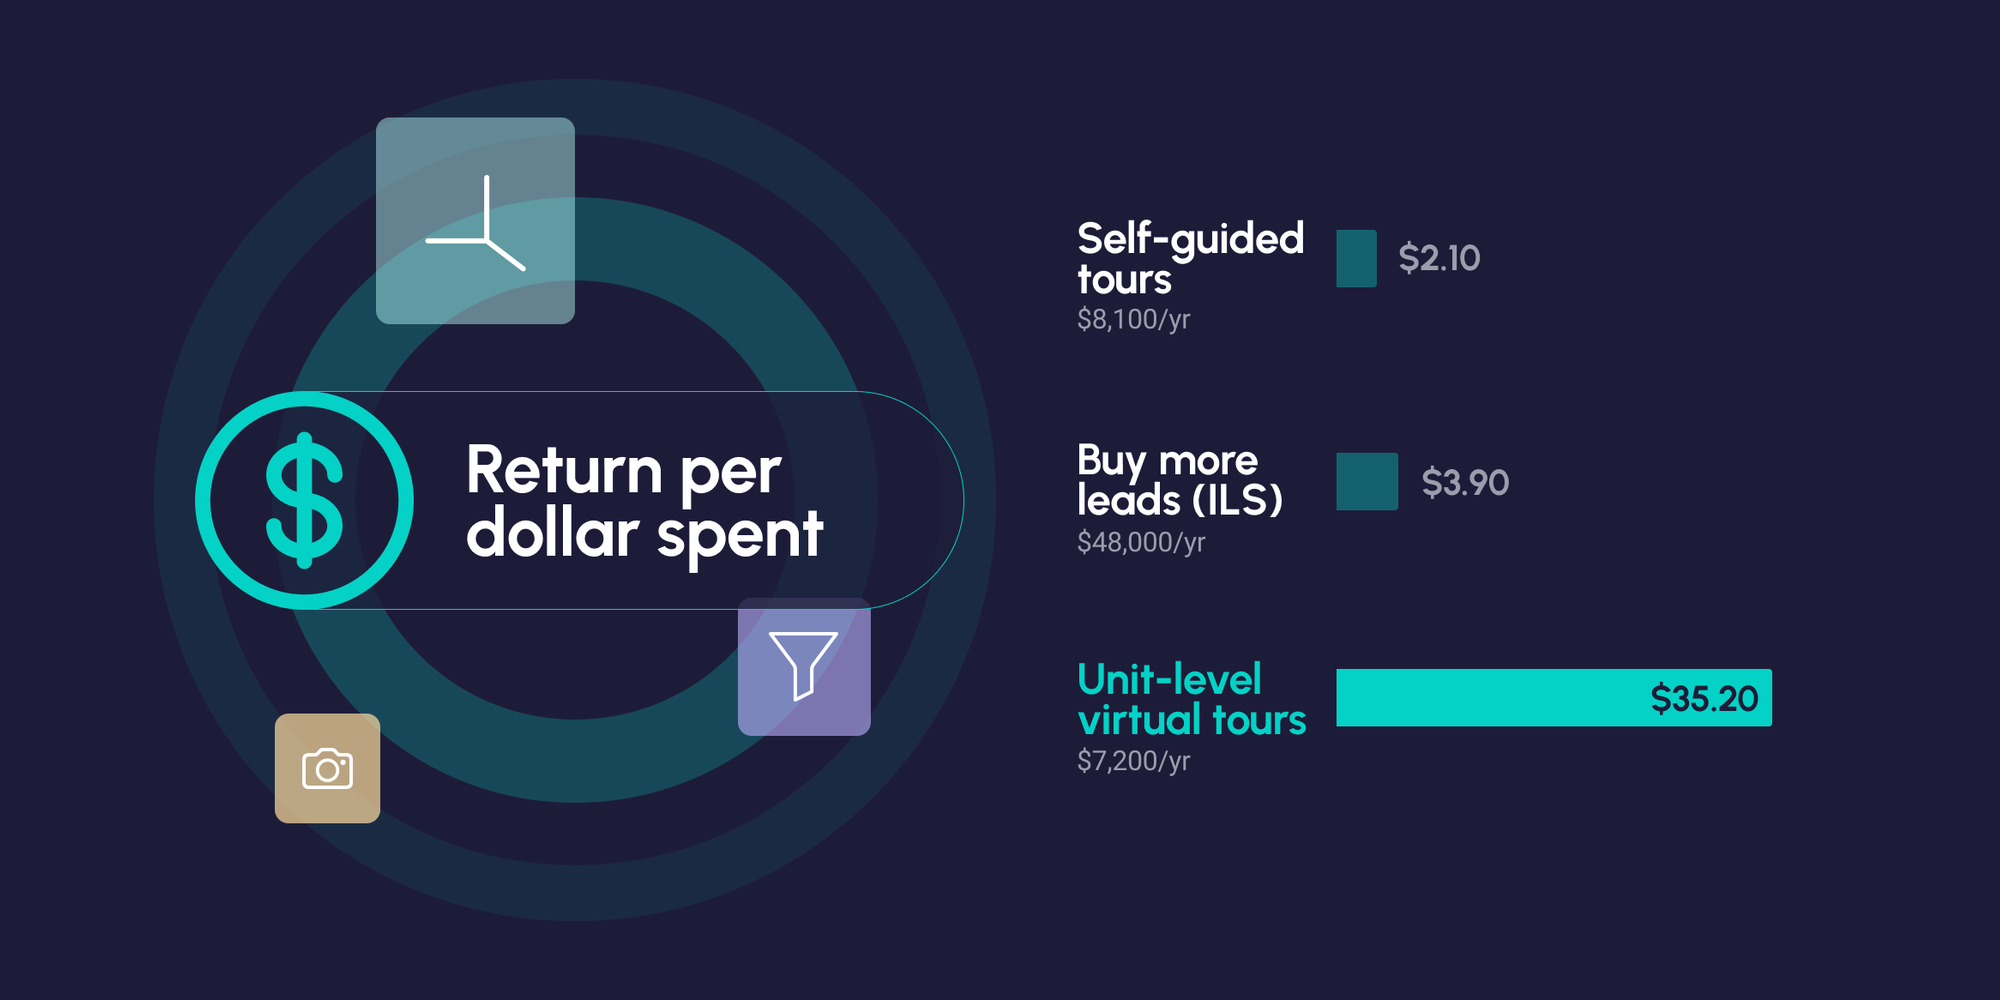
Now buy the lead lift. At $4,000 a month in ILS spend plus $30 a lead, you’re at roughly 133 leads a month and $48,000 a year. Occupancy climbs to 94.44% and you recover $187,563. That’s $3.90 back for every dollar.
So the vendor was telling the truth. More leads = more money.
Now the other side of that decision. Self-guided tours on the same property run $8,100 and move occupancy 0.34 points. You recover $16,631, or $2.05 per dollar.
If those are your two options, buy the leads.
Except they aren’t your only two options. Spend $7,200 on something that answers inquiries 15% faster and converts 10% better, and occupancy goes to 95.37%, higher than the lead play got you. You recover $253,793. That’s $35.20 per dollar.
One-seventh the cost, more money recovered, nine times the return. The 30% claim wasn’t a lie, it just wasn’t the best thing you could have done with the money.
You can also run two versions of the same product against each other. Unit-level 3D tours cost 3.4x more than the floorplan-level version and return 4.9x more, $265,350 against $54,310. The cheaper option is the one that looks responsible in a budget meeting. It’s also the one that leaves $211,040 on the table.
Every number above is on the tool’s conservative setting. When a vendor publishes a range, we’re using the low end.
The whole point of tooling is to buy back your time and add to your bottom line. Marketing is a revenue-generating discipline. Some of that revenue comes from making a prospect comfortable enough to sign. Some from building a brand that makes an A-class building with a koi pond feel like home. But all of it eventually has to show up as dollars.
Run your own property through it and let me know what you think. I’d love suggestions for how to make it better! → Open the budget tool.