Make Every Renovation
Line Item Defensible.
We tag 500+ features across millions of 3D tours, so you can see exactly what moves rent and what real renters actually want. Every line item in your pro forma defends itself.
The Problem
If your pro forma is built on gut feel, it's costing you millions.
Comp opinions and broker hunches get discounted at Investment Committee (IC). Hard numbers don't.
Pro forma line item
Renovation premium
Tested on real deals
$5M of asset value uncovered on a $97M deal.
Cut the Capex
Removed upgrades that weren't moving rent or renter interest. Pull them from scope or redirect the budget.
Reprice the Rent
Flat per-unit math missed how 2BR+ units actually price. Per-sqft against the right comps surfaces $5M of asset value at a 5% cap.
Resequence the Reno
The same renovation pays back more on 3BRs than 1BRs. Do the 3BRs first to lease the highest-return units sooner.
How it works
Four steps from raw data to a defensible deal memo.
Map every feature
Every renovation feature plotted by how much rent it adds and whether real renters actually go for it. See what works at a glance.
Tier into A & B
Table-stakes features (A) vs premium-earning features (B). Budget A first, B for differentiation.
Pre-priced packages
Light Refresh, Standard Value-Add, Heavy Reposition. Each scoped with a validated rent uplift range.
Defend at IC
The output drops into your deal memo. Every line item tied to real data and a confidence score, ready to defend.
Sample Output
This is what you actually get.
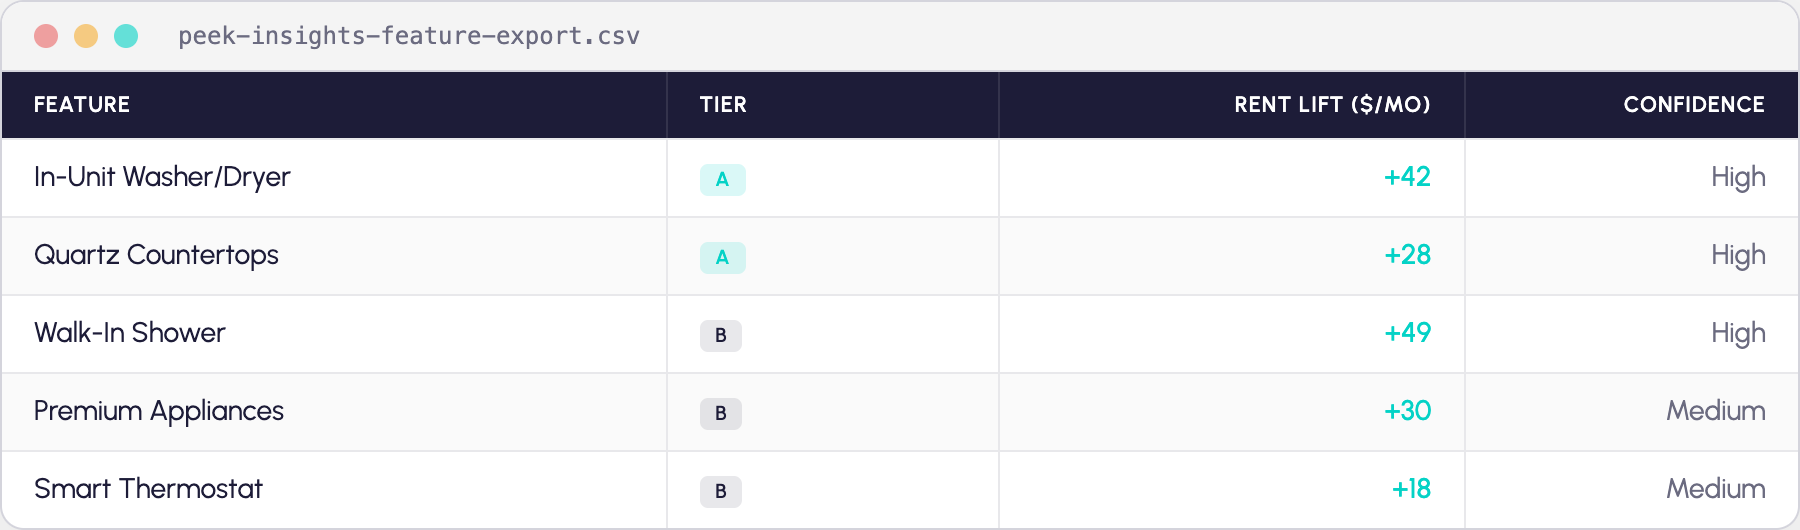
Feature Export
Every renovation feature scored for rent uplift and confidence. Drops straight into your underwriting model.
Ships as CSV · Opens in Excel or AI tool of your choice
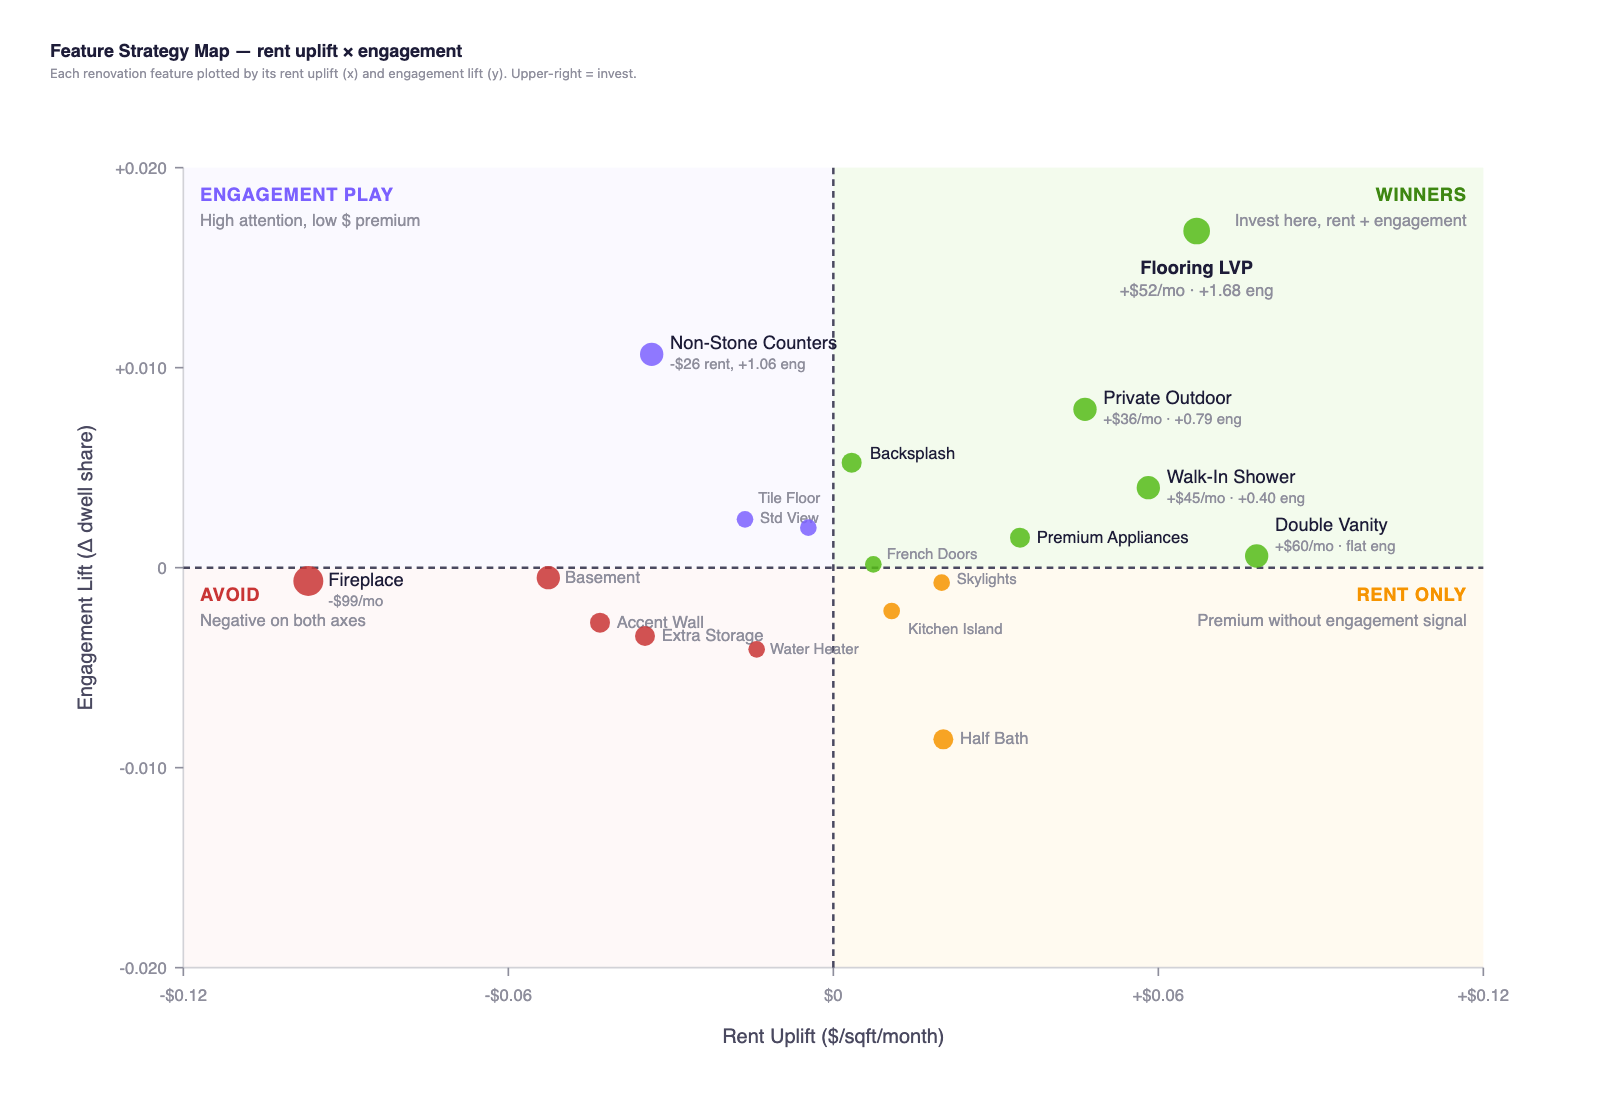
Every Feature Plotted
Rent uplift on one axis, renter engagement on the other. Upper-right = invest, lower-left = cut.
Feature Strategy Map · Rent Uplift × Engagement
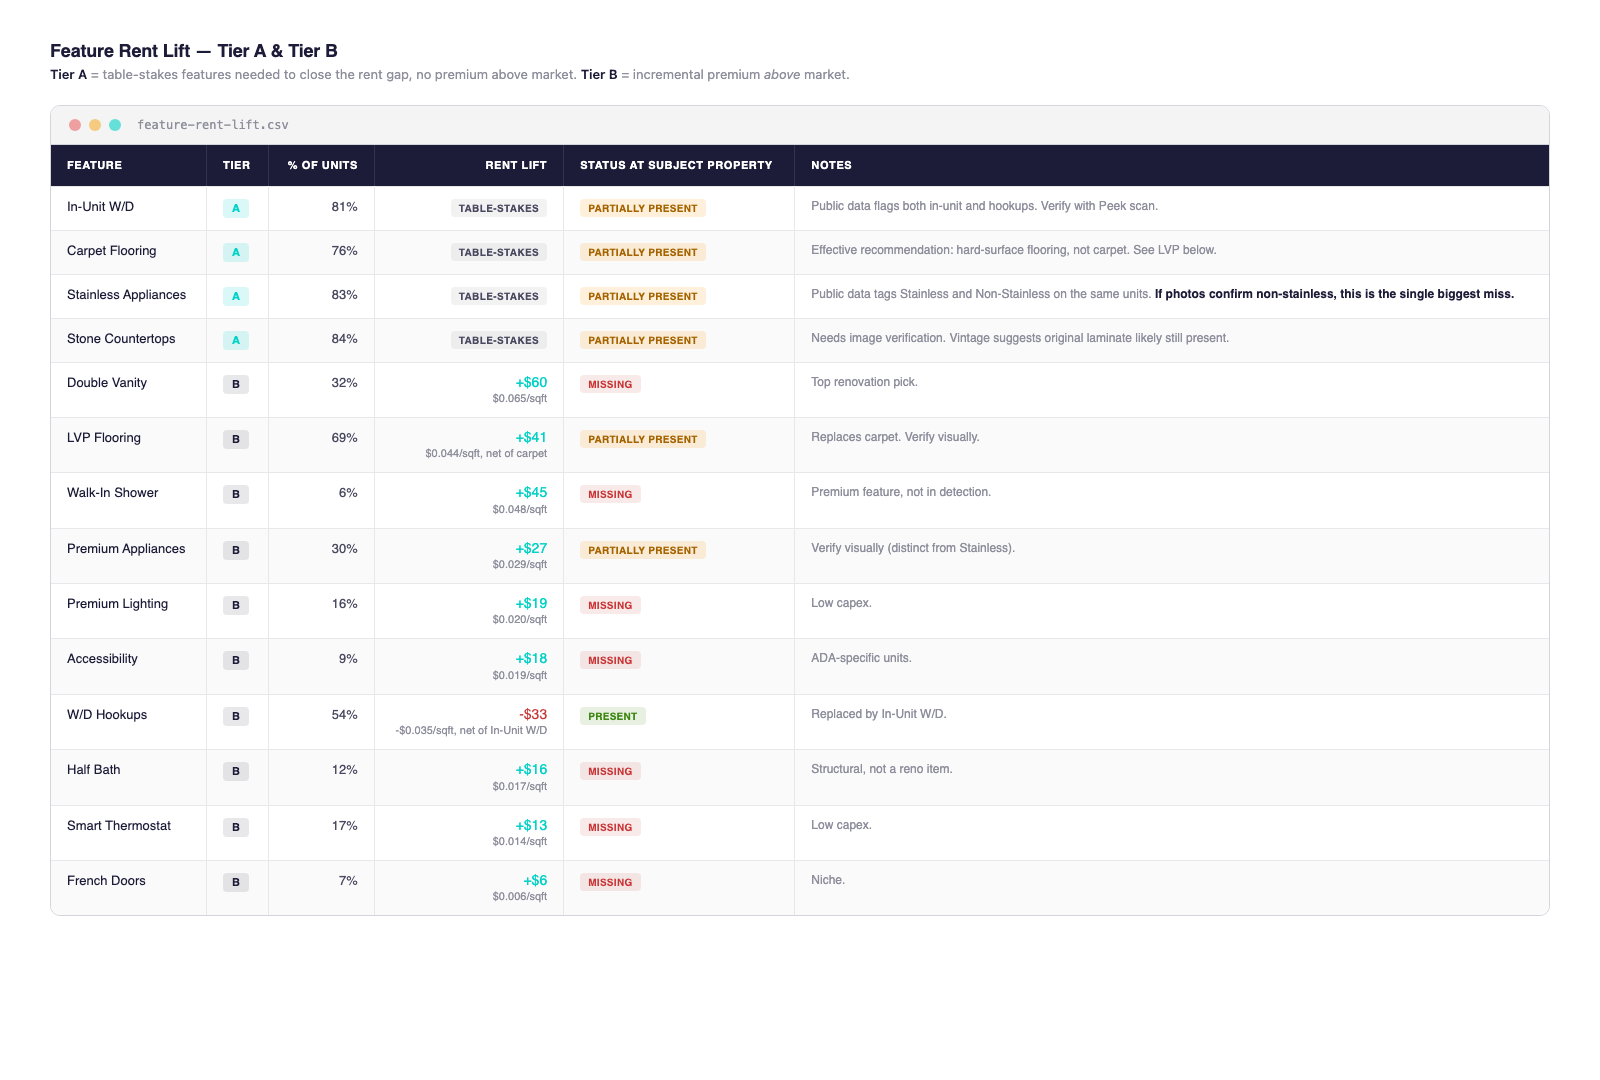
Scored and Tiered
Each line item tiered and grounded in real comp data, not a blanket premium.
Feature Rent Lift · Tier A (table-stakes) vs Tier B (premium uplift)
Where teams use it
Three places it pays for itself.
Acquisitions
Defensible rent uplifts in deal memos.
Replace “the broker thinks +$150” with a feature-by-feature breakdown from real comparable properties.
Capital Allocation
Cut the line items that don't pay back.
See which renovations actually earn rent, and which don't, before the contractor quote lands on your desk.
Asset Management
Reno numbers that hold up with lenders.
Tag every reno line by confidence tier for lender presentations and quarterly reviews.
FAQ
Frequently Asked Questions

See it on a deal you already own.
Send us the pro formas and rent rolls from a closed deal. We'll show you what we would have flagged, and what you got right.